AI Data Profiling Made Easy
Analyze & Understand
AI-Powered Data Profiling: Understand Your Data Instantly
Harness artificial intelligence to analyze, score, and diagnose your data quality faster and smarter than ever before.
Common Data Quality Issues
Common data issues detected during data profiling include missing values, invalid formats, inconsistent data types, and duplicates. Identifying these problems early helps improve data cleansing and boosts the accuracy of any fuzzy matching process. A reliable data matching tool or data matching software starts with thorough profiling.
Benefits of Data Profiling Before Cleansing
- Identify Hidden Errors: Spot nulls, invalid formats, and outliers before they cause downstream issues.
- Understand Data Structure: Gain insight into column types, patterns, and inconsistencies.
- Inform Matching Logic: Detect irregularities that affect fuzzy matching and improve definition accuracy.
- Guide Effective Data Cleansing: Focus cleansing efforts where problems actually exist.
- Save Time and Resources: Avoid unnecessary processing by targeting the right fields.
Identify Duplicates
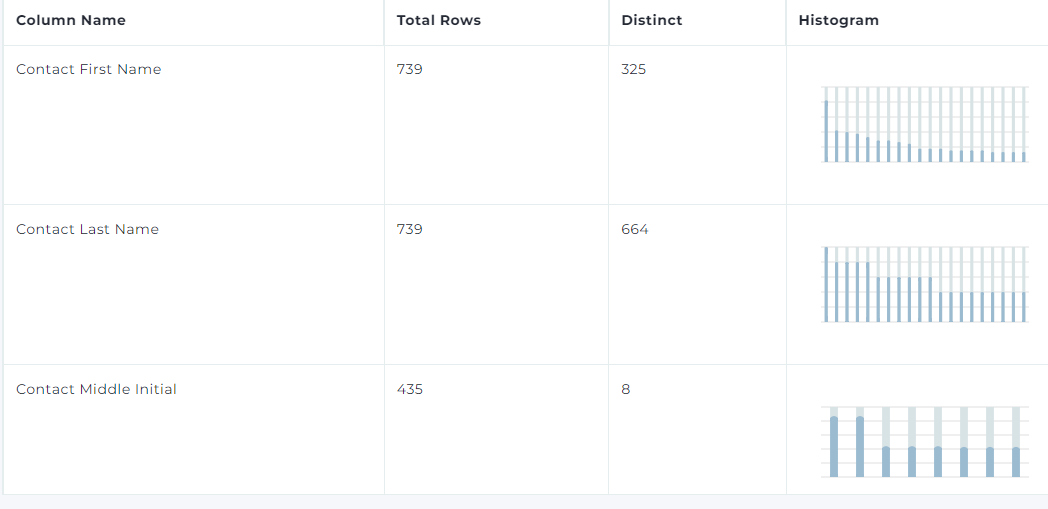
1: Distinct rows can tell you quickly how much duplication you have in a column.
2: Histograms also make it easy to see the repetitive values contained in a column.
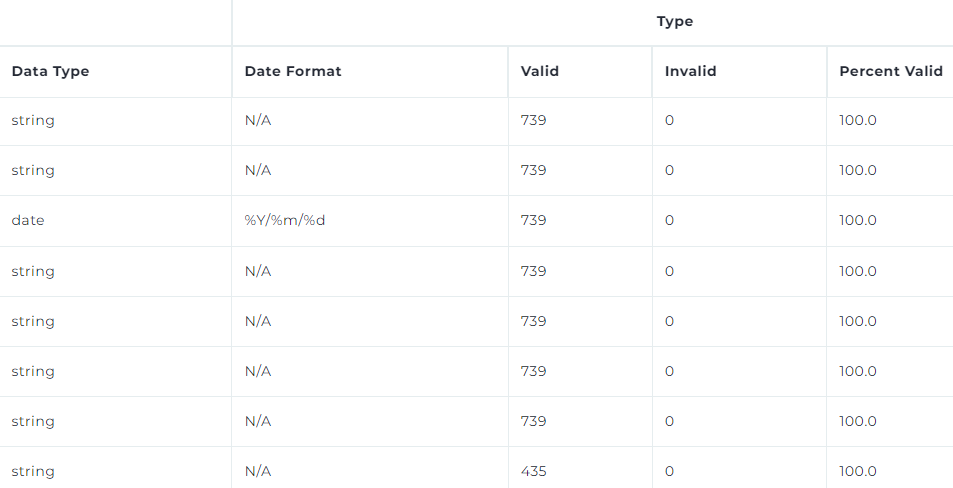
Ensure Data Consistency Before Cleansing
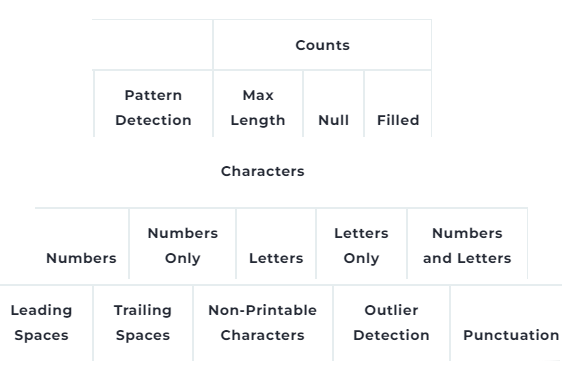
- Does the data set and all of the data contained in each of the fields or columns, match requirements? How many different ways do dates and phone numbers appear? This module looks at the syntax and field types.
- Valid and invalid values can be easily flagged, visualized and corrected as needed.
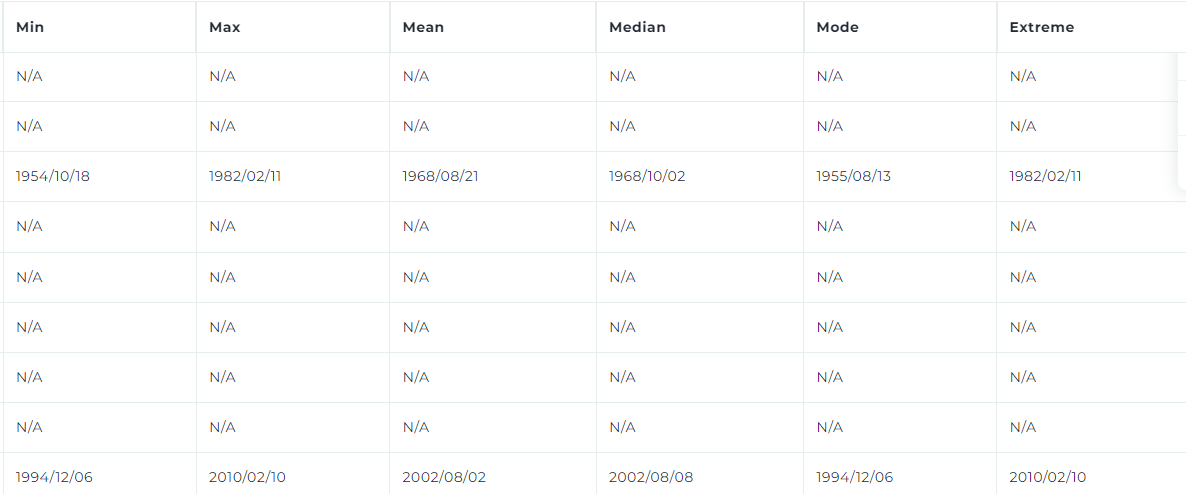
Easily Find Trends
1: Statistical profiling for numeric and string values.
2: Easily identify the minimum, maximum, mean, median, mode, and extreme values in each column.
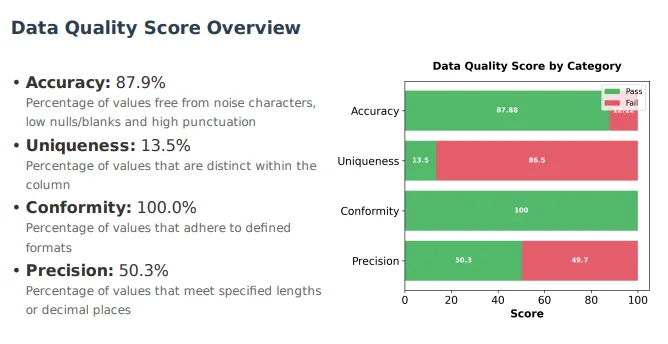
AI Data Profiling Report
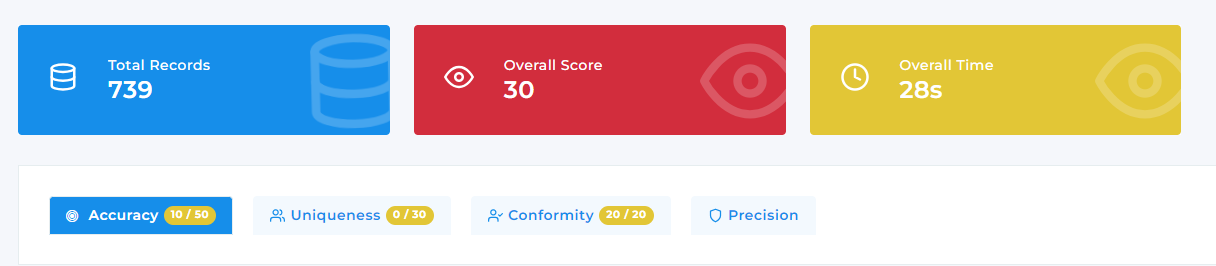
Automated Insight Generation: AI interprets patterns, detects anomalies, and creates profiling reports automatically.
AI-Driven Quality Scoring: Lightweight AI models calculate accuracy, uniqueness, conformity, and precision scores—and explain them.
Smart Rule Recommendations: Based on profiling results, AI can suggest cleaning and matching rules to prepare data for deduplication and integration.
AI analyzes column-level summary data (e.g., null%, punctuation, type matches).
AI suggests cleansing rules, defines fuzzy-matching criteria, and highlights key risk areas with real explanations.
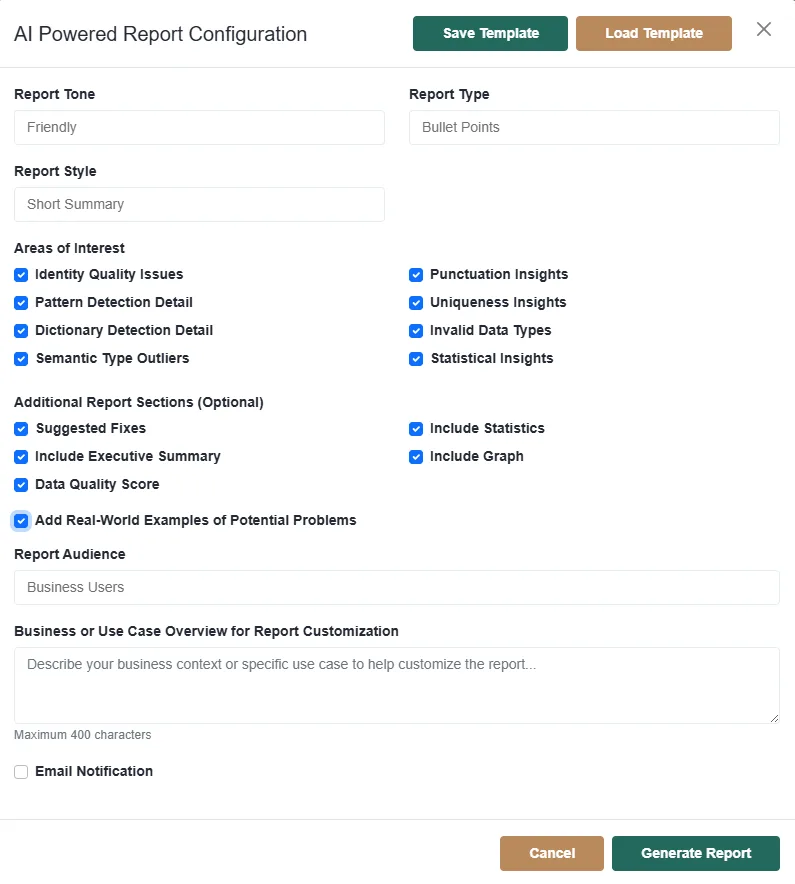
AI Data Profiling Report Options
Tone: Friendly → Conversational, accessible to non-technical stakeholders
Style: Short Summary → Keep it concise and to the point
Type: Bullet Points → Easy to scan
Audience: Business Users → Focus on practical, high-level insights, not technical deep-dives
Areas of Interest: Includes identity, uniqueness, patterns, punctuation, statistical insights → Tell AI to cover those topics specifically
Additional Sections: Executive summary, suggested fixes, examples → Explain real-world impact and show quick wins
Pattern & Format Detection
Uncover hidden patterns and non-standard formats in names, addresses, phone numbers, emails, and more. Match Data Pro uses regex-based analysis and custom dictionaries to detect structured inconsistencies—like uppercase vs. lowercase, misplaced delimiters, or unusual word combinations—so you can standardize your data with confidence before running any data matching tool or cleansing operation.
Sample Customization Content (for AI Prompting)
We are preparing data for an upcoming CRM migration and need to identify identity quality issues and formatting inconsistencies. Please focus on highlighting uniqueness problems, punctuation anomalies, and invalid data types. Include actionable suggestions and real-world examples that align with B2B contact data (e.g., names, emails, phone numbers). The executive team will review this, so include a short executive summary with visuals.
Data Profiling Overview – Scan, Score, and Understand Your Data
Get a quick walkthrough of how Match Data Pro profiles your data—detecting nulls, inconsistencies, invalid formats, and more. See how profiling sets the stage for effective data cleansing and accurate fuzzy matching.