
Explainable entity resolution shows exactly why two records were linked or kept separate — field-by-field similarity scores, algorithm weights, threshold decisions, and a timestamped audit trail. Without that transparency, a data governance or compliance review becomes guesswork. With it, every match decision can be interrogated, corrected, and defended. This guide explains how explainability works inside a production entity resolution pipeline and what it takes to build one that satisfies both engineers and auditors.
Want to see explainable matching in action? Start a free trial of Match Data Pro and run your first auditable entity resolution job in minutes — no contract required.
Why Explainability Matters in Entity Resolution
Entity resolution identifies records that represent the same real-world entity across different systems. A hospital may hold the same patient as “Robert Johnson, DOB 04/12/1978” in its EHR and “Rob Johnson, DOB 04-12-78” in its billing platform. A standard match engine links the two. But what if a reviewer asks: why were those records merged, and on which evidence?
Without explainability, the answer is a black box. The system matched them. That is all you can say. That is not good enough for:
- Regulatory audit. GDPR, HIPAA, and financial conduct regulations increasingly require that automated decisions affecting individuals can be explained and contested.
- Data steward review. Stewards need to understand borderline matches before approving golden record creation.
- Model tuning. Engineers can only improve match thresholds if they can see exactly which fields caused false positives or missed matches.
- Downstream trust. Analytics teams only trust a master customer record when they understand how it was assembled.
Explainability is not a reporting feature bolted on after the fact. It is a design requirement for the match pipeline itself — from AI data profiling through scoring, review, and golden record output.
The Anatomy of an Explainable Match Decision
Every entity resolution decision has three layers that must be visible to be explainable.
Layer 1: Field-level similarity scores
The match engine compares individual fields and assigns a score to each. Consider two candidate records:
| Field | Record A | Record B | Algorithm | Score |
|---|---|---|---|---|
| First name | Robert | Rob | Jaro-Winkler | 0.91 |
| Apellido | Johnson | Johnson | Exact | 1.00 |
| Date of birth | 04/12/1978 | 04-12-78 | Normalised date | 1.00 |
| Address line 1 | 14 Oak Street | 14 Oak St | Token sort ratio | 0.94 |
| Phone | 555-0142 | (555) 014-2 | Digit normalisation | 1.00 |
Each score tells an engineer exactly where the match is strong and where it is ambiguous. A score of 0.91 on first name is high — “Robert” and “Rob” share a root. But if first name scored 0.55 (say, “Robert” vs. “Roger”) that field becomes evidence against the match, not for it.
Layer 2: Weighted composite score
Field scores are combined using configurable weights. A last name match may carry 30% of the composite score; a date-of-birth match 25%; first name 20%; address 15%; phone 10%. The weighted sum produces the final match score — say 0.97 out of 1.00 for the example above. The matching rule scoring algorithms that produce this composite must be documented and version-controlled so that threshold changes can be traced to specific configuration edits.
Layer 3: Threshold routing and decision
The composite score is compared against thresholds:
- Auto-link band (e.g., score ≥ 0.92): records are linked automatically. No human involvement required.
- Review band (e.g., 0.75 – 0.91): records enter a human review queue. The reviewer sees the field-level scores, not just the composite, and makes the final call.
- Auto-reject band (e.g., score < 0.75): records are kept separate. The rejection reason is logged.
Every routing decision — auto-link, review, reject — must be captured with the score, the active threshold at the time, and the timestamp. This is what creates an auditable record. For a deeper look at how these algorithms are structured, see the guide to fuzzy data matching and entity resolution.
The Explainable Entity Resolution Pipeline
Below is the end-to-end pipeline that Match Data Pro runs for explainable Senzing entity resolution jobs. Each stage feeds structured metadata into the audit trail.
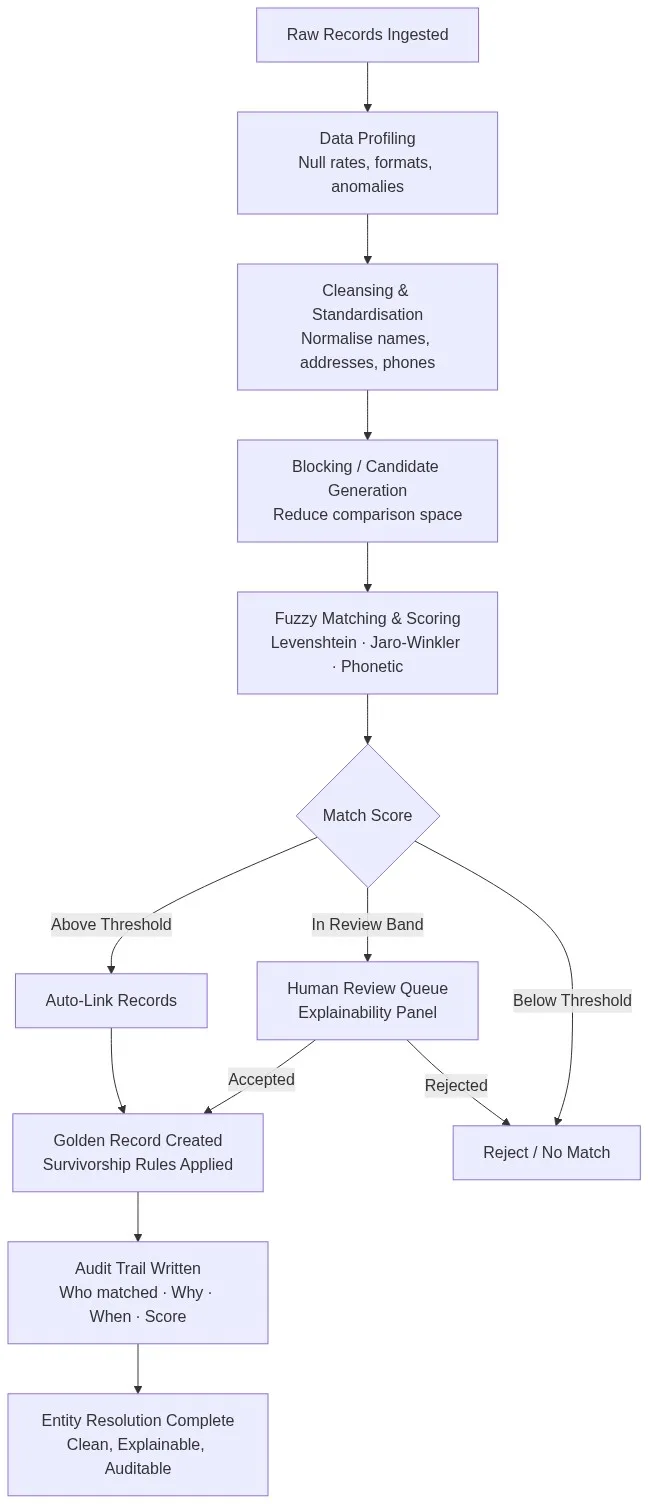
Stage 1: Profiling
Before any matching begins, AI data profiling identifies field-level completeness, format patterns, and anomalies. A field with 40% null values is a weak match signal — that context must carry forward so that a reviewer understands why a particular field contributed little to the composite score.
Stage 2: Cleansing and standardisation
Inconsistent formats — dates as “04/12/78” vs. “April 12, 1978”, phone numbers as “5550142” vs. “+1-555-0142” — inflate false negatives if not normalised before comparison. Data cleansing and standardisation must be applied before scoring. The transformations applied to each field are logged so that reviewers can see the pre-normalised and post-normalised values side-by-side.
Stage 3: Blocking
Blocking partitions the dataset into candidate pairs for comparison. Common blocking keys include the first three characters of a last name plus birth year, or postcode plus first two characters of a street name. The blocking key used for each pair is stored in the audit trail. If a match is missed, an engineer can check whether the two records were even candidates — a common diagnostic question during post-run reviews.
Stage 4: Fuzzy matching and scoring
Each candidate pair is scored across configured fields using the selected fuzzy matching algorithms — Levenshtein, Jaro-Winkler, phonetic (Soundex, Metaphone), token sort, and numeric range comparisons for fields like revenue bands or zip codes. The output is a structured score object, not a single number, so that every field contribution is visible.
Stage 5: Review and decision capture
Records in the review band appear in a steward interface showing both records side-by-side, with field-level scores highlighted. A score of 0.55 on first name is flagged in amber; 0.91 in green. The reviewer accepts or rejects the match, optionally adding a note. That decision — along with the reviewer’s identity, timestamp, and the score at decision time — is written to the audit log.
Stage 6: Golden record creation
Accepted matches produce a golden record through survivorship rules and golden record creation logic: for each field, the system selects the most complete, most recent, or most trusted value across the matched records. The survivorship decision for each field is also logged — so the golden record is traceable back to its source records field by field.
What the Audit Trail Must Contain
An audit trail that satisfies compliance and governance requirements needs at minimum:
- Record pair IDs — the source system IDs for both records in every comparison.
- Per-field similarity scores — algorithm used, pre-normalised value, post-normalised value, score.
- Composite score — weighted sum and the field weights active at run time.
- Threshold band at decision time — auto-link, review, or reject threshold values used.
- Routing outcome — auto-linked, sent to review, auto-rejected.
- Human review record (where applicable) — reviewer identity, decision, notes, timestamp.
- Golden record survivorship log — which source record supplied each field of the output.
- Configuration version — the match definition version in effect, so that historical decisions can be replayed against the same rules.
This data should be queryable. A compliance officer who asks “show me every record linked to patient ID 88342 and the evidence for each link” should get a structured answer in seconds, not a manual data extraction exercise.
Common Explainability Failure Modes
Most entity resolution implementations break down at explainability in predictable ways.
Single composite score only
Storing only the composite score — 0.87 — tells a reviewer nothing about which fields drove the result. Was it a strong name match with a weak address? A perfect address match with an ambiguous name? The composite alone cannot answer that. Always persist the full field-score object.
No pre-normalisation snapshot
If the audit trail shows only normalised values, a reviewer cannot verify whether the original data was correctly parsed. Store both the raw input value and the normalised value for each field in every comparison.
Configuration drift without versioning
Threshold changes made without version control mean that decisions made six months ago cannot be replicated or understood today. Tag every match run with the configuration version that produced it.
Human review decisions not captured
If a steward manually approves a borderline match but the system only records the final linked state — not the human decision — there is no way to distinguish machine-automated links from human-approved ones. These two categories carry different risk and accountability profiles and must be tracked separately.
How Match Data Pro Delivers Explainable Entity Resolution
Match Data Pro is built for auditable data matching and merging from end to end. Every job captures field-level scores, algorithm selections, threshold routing, and human review decisions in a structured log that can be exported or queried.
- Configurable match definitions. Engineers set field weights, choose algorithms per field, and define auto-link, review, and reject bands. Every configuration change is versioned.
- Side-by-side review UI. Borderline pairs display raw and normalised values with colour-coded field scores, so reviewers make informed decisions rather than guesses.
- Full audit export. Job audit logs export to CSV or JSON for compliance teams, with record pair IDs, scores, weights, thresholds, and reviewer decisions in one file.
- Senzing integration. For complex entity resolution across multiple source systems, Match Data Pro integrates Senzing’s probabilistic engine while wrapping every resolution decision in the same explainability and audit framework.
- Job automation. Scheduled match jobs run on a defined cadence, each tagged with the configuration version and a job ID that anchors every audit record.
Match Data Pro is a cloud SaaS platform — no infrastructure to provision, no long-term contract. Start a free trial and run your first explainable entity resolution job today. Or schedule a demo to see the audit trail and review interface in a live walkthrough.
Frequently Asked Questions
What is explainable entity resolution?
Explainable entity resolution is an approach to record linkage in which every match or non-match decision is accompanied by field-level similarity scores, algorithm details, composite weights, threshold routing logic, and a full audit trail. This allows data engineers, stewards, and compliance teams to inspect, verify, and contest any individual decision the system makes.
Why do regulators care about explainability in data matching?
Regulations including GDPR Article 22 and financial conduct frameworks require that automated decisions affecting individuals can be explained and challenged. Entity resolution decisions — linking patient records, customer accounts, or financial identities — can affect individuals directly. An explainable system provides the evidence trail needed to satisfy a regulatory inquiry or subject access request within required response windows.
What is the difference between a match score and an explainable match score?
A match score is a single composite number — say 0.87 — that summarises record similarity. An explainable match score breaks that composite into its components: each field’s similarity score, the algorithm used, the weight applied, and the normalised values compared. The composite alone tells you a match was found; the explainable score tells you why and with what confidence in each dimension.
How should the human review queue be designed to support explainability?
The review interface should display raw and normalised field values for both records side-by-side, colour-code field-level scores (green for high confidence, amber for borderline, red for low), show the composite score and the active threshold, and capture the reviewer’s decision and timestamp. Every accepted or rejected review decision must be written to the audit log with the reviewer’s user ID so the decision is attributable.
Can explainable entity resolution work at scale without slowing the pipeline?
Yes. The field-score objects are small structured records — typically under 2 KB per pair — and writing them to an append-only log adds negligible latency to the comparison step. The performance cost of explainability comes from storage volume, not compute. For a job comparing 50 million pairs, the audit log may reach 80-100 GB, so log retention and query indexing need to be part of the architecture design from the start.